Location
All events are stored with the user's location if available and enabled. The location is stored as [latitude, longitude] and it's captured by the device GPS if the user is using the Mobile SDK, or the Geo IP location if the user is accessing the platform via a web browser. Accuracy depends on the source used: GPS will always be more precise than Geo IP.
Please note that location services accuracy varies between locations, times of day, different weather conditions and a lot of other external elements. It is important that the use cases to be implemented are throughly documented and evaluated, as the Demo application and the standard campaigns cover most of the cases, but not all. For example, if an use case requires high accuracy (ie, a bank application that uses geofences at ATM locations) the application must be configured accordingly, as notifications cannot be delivered when the user is 200 meters away from the ATM. Likewise, an application that records events when user leave a city cannot check for location updates every 10 meters and impact the user's battery.
Additionally, please remember that the Messangi SDK is a trigger/event based framework that connects a mobile app with the Campaign Manager and the Business Intelligence and Analytics platform. This means that if the user loses connectivity while executing an action that fires a trigger (entering/exiting a region for example), the trigger itself and any action associated to it may be delayed. Please take this into account when designing the user experience around the use case.
One important caveat is that location is only available if the location was known when the event was triggered, so the Traffic dashboard will not contain the user's location unless provided by the carrier.
Maps
Whenever an event is registered in the platform the Business Intelligence and Analytics platform tries to determine the user's location using a fallback mechanism. If the event was generated by the SDK and the GPS location is available then it is used; if it's not available or the GPS information is not provided then the GeoIP information for the corresponding IP address is used. If the GeoIP information is not complete or unreliable then the event headers are inspected to extract any information about the upstream server and it's GeoIP information is used instead.
Two different maps are used to display the events locations:
Cluster Map
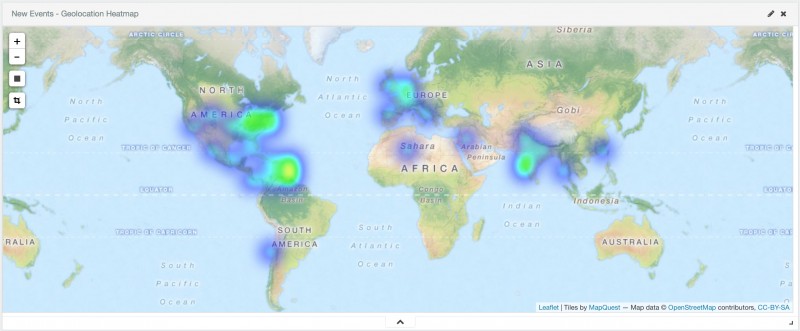
Heat Map
The Cluster Map shows events aggregated per region, showing bigger and darker circles as more events are grouped in the same area. The Heat Map shows the approximate distribution of tendencies or trends. In any of these maps zoom and filtering are available.
From top to bottom in the maps the buttons are:
- Zoom In: Increase the zoom level
- Zoom Out: Decrease the zoom level
- Draw a rectangle: Draw a rectangular area in the map and add a filter to the dashboard to show events only inside that area.
- Fit data bounds: Fit the map to the data bounds. This will zoom the map In or Out to a point where all the events in the dashboard are visible and occupy most of the map area.
Events in nearby locations are aggregated in the Cluster Map and associated in the Heat Map. Please note that the Heat Map allows you to double click a region to zoom, but the Cluster map does not.

