Dashboard
The Business Intelligence & Analytics platform provides a web based dashboard that can be used to create filters and aggregations to visualized the data and extract intelligence from user's interactions. Dashboards can be created and visualized using any compatible web browser.
In the dashbords we filter Events in order to create Aggregations that display detailed behavior information from different campaigns and channels, both live and archived. It's important to highlight that by clicking on almost any colored option in the dashboard will add a new filter and update all the displayed data in all charts and tables.
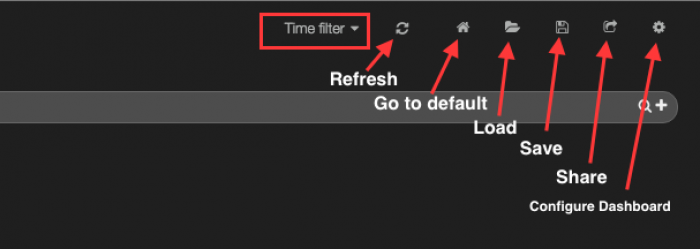
There are several elements on the page that will help us filter and obtain the statistics we’re looking for. Every Dashboard has the following elements on the top of the page:

The top buttons are:
- Time filter: Here you can set the time from when you want to apply the filter and to limit the results only to that period.
- Refresh: By clicking on this button you'll get most recent statistics for the active dashboard.
- Go to default: By clicking on this button you'll be redirected to the “Default dashboard”. In order to set a Dashboard as “Default” first it must be saved and then set is as “Default”
- Load: A file or dashboard that has been previously configured can be loaded from here
- Save: You can save actual dashboard or export the schema to a file
- Share: The current Dashboard can be shared by clicking on this link. This will generate an URL that can be shared with others.
- Configure Dashboard: From here you can configure dashboard's color, rows, date/time format etc.
Query Box
In the query box you can type in a query that follows the Kibana query and filter format. Please note that you can only use predefined fields present in the stored data.
In the above example the results will only show interactions that have the countrycode as “US” and the app is scratchcard.
Event types
Each event has an associated Event Type. This chart shows all the event types for the filtered results. Once you add or remove a filter the values on this chart are updated to reflect only the event types for the filtered events. Clicking on an event type will add a filter and show only events of that type in the dashboard.
Map
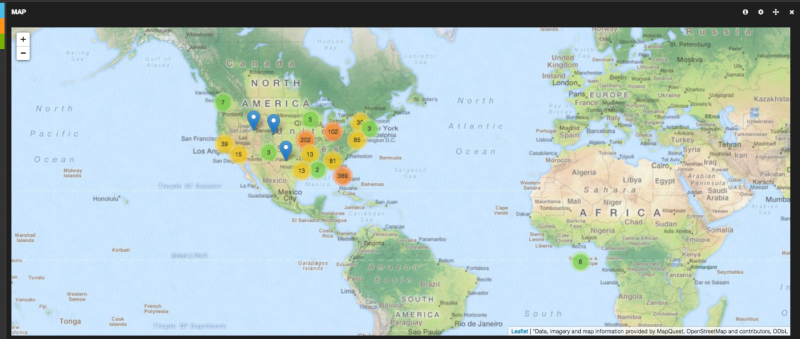
All events that contain a location value are displayed in the map. Please note that some events may not contain a location value as the user may have turned off his/her GPS. Also, the platform uses a fallback mechanism to try an guess the location of the user. If the event was generated from the Android or iOS SDK and the user has the location services enabled then the location is captured from the handset location services framework. If the location is not available or the event was generated by an HTTP based application (such as Scratchcard, Passbook, URL redirect, etc) the location is obtained from the GeoIP information associated with the IP address.
Please refer to Location for more information.
Clients
This area shows all the internal platform client IDs. This is only relevant for users that have multiple client IDs associated to their account (such as Resellers).
Applications
Different applications can generate events to the same Business Intelligence & Analytics platform. This chart shows all the applications that have generated events that match the filtering criteria. Each SDK enabled mobile app will be displayed here as one Application (Android and iOS devices are aggregated, but they can be differentiated using the Platform field). Other applications that may show are Scratchcards, Passbook, etc. Since the Application name is a parameter in the event reporting method you can send any arbitrary name via the REST API and it will be displayed and aggregated here.
Platforms
The Platform chart displays the platform on which the event was generated. If the event was generated by the Mobile SDK the platform is either Android or iOS. If the event was generated by a web interaction (Scratchcard, Passbook, Redirect URL, etc) the platform will be the user-agent.


